Appendix: Making Sense of Studies and Explanations
Some SAT passages are packed with unfamiliar species, chemicals, places, or research methods. You usually do not need to understand every technical detail. Focus on what happened: Did the researchers compare two situations, propose an explanation, or determine what the evidence could prove?
These passages can appear in several question types, including Logical Completion, Command of Evidence, Cross-Text Connections, Main Idea and Details, and Text Structure and Purpose. The moves in this appendix help you understand the passage. Then use the approach for the question type to answer the question.
Four Ways to Make Sense of the Passage
You do not use these four moves in order, and you do not need all four for every passage. Each section focuses on one move. On a real question, use whichever move—or moves—fits the reasoning in the passage.
1. Reduce the passage to a pattern or comparison.
Ignore the technical names for a moment. What changed? What was compared? What happened in each situation?
2. Ask what the explanation would predict.
If the explanation were correct, what else should you expect to observe? Evidence that matches the prediction supports the explanation. Evidence that conflicts with it weakens the explanation.
3. Explain how the evidence supports the conclusion.
Ask how the evidence leads to the conclusion. The connection may be a proposed mechanism or an assumption that must be true for the conclusion to work.
4. Check what the evidence can actually establish.
Does the study include the comparison it needs? Is the sample representative? Could something else have produced the result? Make sure the conclusion does not claim more than the evidence shows.
Use arrows for relationships. A positive relationship becomes X ↑, Y ↑. A negative or inverse relationship becomes X ↑, Y ↓.
Training
Move 1: Reduce It to a Pattern or Comparison
Technical passages often become much simpler when you turn them into arrows or a short comparison.
Optimal foraging theory (OFT) holds that animals' foraging behaviors reflect cost-benefit trade-offs that vary by species and with dynamic ecological circumstances. One such circumstance is lunar intensity, which Upham and John Hafner found to be negatively associated with foraging by desert kangaroo rats but Eduardo Fernández-Duque and colleagues found to be positively associated with foraging by Azara's night monkeys. This discrepancy is explicable in terms of OFT: the monkeys' greater reliance on vision means that higher lunar intensity benefits them more than it benefits the kangaroo rats.
According to the text, the difference between Upham and Hafner's findings and Fernández-Duque and colleagues' findings can be attributed to which difference between desert kangaroo rats and Azara's night monkeys?
As lunar intensity increases, what happens to each species’ foraging?
What difference between the species does the passage use to explain those opposite patterns?
Show answer choices
A) The kangaroo rats decrease their foraging activity as lunar intensity increases, whereas the monkeys increase their foraging activity.
B) The kangaroo rats are more vulnerable to predators than the monkeys are.
C) The kangaroo rats are less reliant on vision than the monkeys are.
D) The kangaroo rats encounter different levels of lunar intensity than the monkeys do.
Reveal answer and analysis
Answer: C
Translate the relationships:
More moonlight → less rat foraging
More moonlight → more monkey foraging
The passage explains the opposite patterns by saying that the monkeys rely more heavily on vision. In other words, the kangaroo rats are less reliant on vision, which is what C says.
A — This restates the patterns but does not identify the difference that explains them.
B — The passage does not compare the species' vulnerability to predators.
D — Nothing says that the species experience different levels of moonlight.
| Crowd feature | Before obstacle | After obstacle | Overall |
|---|---|---|---|
| Density | 0.8592 | 0.7308 | 0.7447 |
| Velocity | −0.9357 | −0.9518 | −0.8587 |
Researcher Xiaolu Jia and colleagues monitored individuals' velocity and the surrounding crowd density as a group of study participants walked through a space and navigated around an obstacle. Participants rated how congested it seemed before the obstacle, after the obstacle, and overall, and the researchers correlated those ratings with velocity and density. (Correlations range from −1 to 1, with greater distance from 0 indicating greater strength.) The researchers concluded that the correlations with velocity are stronger than those with density.
Which choice best describes data from the table that support the researchers' conclusion?
As crowd density increases, do people rate the crowd as more or less congested? What about as their speed increases?
According to the passage, how can you tell which correlation is stronger?
For each of the three ratings, is the correlation with velocity or with density stronger?
Show answer choices
A) The correlation between congestion ratings before the obstacle and density is further from 0 than the correlation between overall congestion rating and velocity is.
B) The correlation between congestion ratings before the obstacle and velocity is further from 0 than the correlation between congestion overall and velocity is.
C) For each of the three ratings, the correlation with velocity is negative while the correlation with density is positive.
D) For each of the three ratings, correlations with velocity are further from 0 than the corresponding correlations with density are.
Reveal answer and analysis
Answer: D
The positive density correlations mean that congestion ratings rise as density rises. The negative velocity correlations mean that congestion ratings rise as velocity falls. The sign gives the direction of each relationship.
Strength is determined by distance from 0, not by whether the number is positive. In every column, the velocity correlation is farther from 0 than the corresponding density correlation:
- Before: −0.9357 is farther from 0 than 0.8592.
- After: −0.9518 is farther from 0 than 0.7308.
- Overall: −0.8587 is farther from 0 than 0.7447.
A — It compares the before-obstacle density correlation with the overall velocity correlation. The researchers' conclusion requires comparing velocity with density for the same rating.
B — It compares two velocity values rather than comparing velocity with density.
C — It accurately describes direction, but the conclusion is about strength.
Move 2: Ask What the Explanation Would Predict
A proposed explanation becomes easier to test once you decide what result it would lead you to expect.
The bird species Hylophilus ochraceiceps (the tawny-crowned greenlet) shares some territory in French Guiana with Thamnomanes caesius (the cinereous antshrike), which emits a loud alarm call when it detects predators. Biologist Ari Martinez and colleagues recorded T. caesius alarm calls and played them in the vicinity of wild H. ochraceiceps. Finding that the birds often froze in place or scattered into vegetation upon hearing the calls, they concluded that H. ochraceiceps associates T. caesius alarm calls with danger.
Which finding, if true, would most directly support Martinez and colleagues' conclusion?
How did the greenlets react when the researchers played the antshrikes’ alarm calls?
What did the researchers conclude that the greenlets associate those calls with?
What comparison would help test whether the greenlets associate the alarm calls with danger?
Show answer choices
A) When Martinez and colleagues played control sounds of random noise in the vicinity of H. ochraceiceps, the birds displayed no reaction.
B) Other bird species than H. ochraceiceps also showed a tendency to freeze in place or scatter into vegetation when Martinez and colleagues played T. caesius alarm calls.
C) Martinez and colleagues played alarm calls from different T. caesius individuals and observed no significant variation in the responses of H. ochraceiceps.
D) In some instances, H. ochraceiceps froze in place or scattered into vegetation when Martinez and colleagues approached but before they began playing sounds.
Reveal answer and analysis
Answer: A
A comparison sound helps distinguish a response to the alarm call from a response to sounds generally. The lack of a reaction to random noise in A supports the researchers’ interpretation, though it does not by itself prove that the birds associate the call with danger.
B — The responses of other species do not isolate what caused this species' reaction.
C — Similar responses to different callers do not rule out the possibility that the birds react to any loud sound.
D — Reactions before any sound was played suggest that another trigger may be responsible.
In the United States, firms often seek incentives from municipal governments to expand to those municipalities. A team of political scientists hypothesized that municipalities are much more likely to respond to firms and offer incentives if expansions can be announced in time to benefit local elected officials than if they can't. The team contacted officials in thousands of municipalities, inquiring about incentives for a firm looking to expand and indicating that the firm would announce its expansion on a date either just before or just after the next election.
Which choice best describes data from the graph that weaken the team's hypothesis?
According to the team’s hypothesis, would municipalities be more likely to respond and offer incentives if the firm announced its expansion before or after the election?
What finding would go against that hypothesis?
Show graph and answer choices
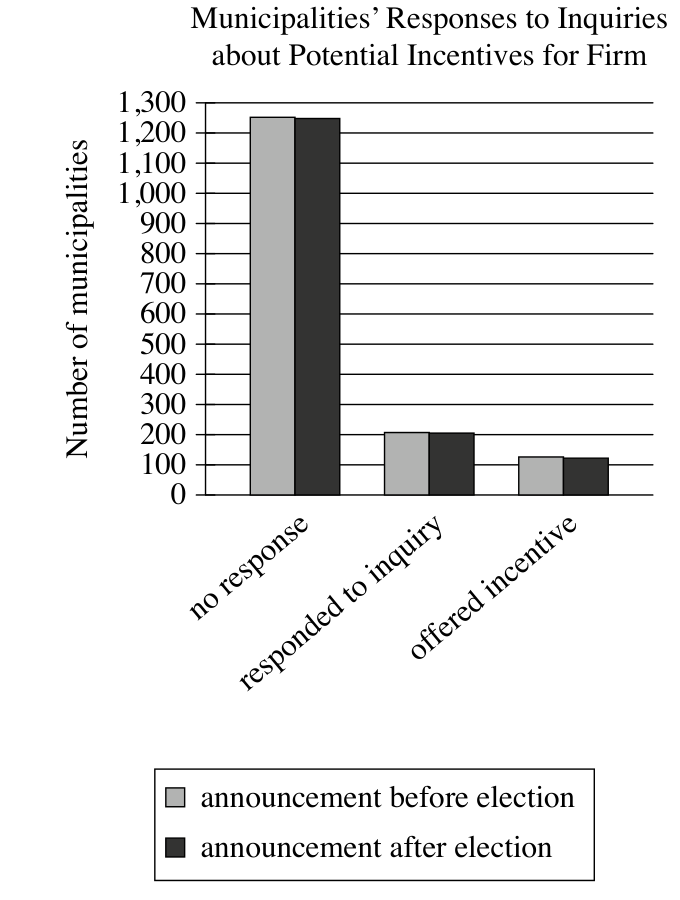
The team’s hypothesis: Municipalities are much more likely to respond to firms and offer incentives if expansions can be announced in time to benefit local elected officials than if they can’t.
Which choice best describes data from the graph that weaken the team's hypothesis?
A) A large majority of the municipalities that received an inquiry mentioning plans for an announcement before the next election didn't respond to the inquiry.
B) The proportion of municipalities that responded to the inquiry or offered incentives didn't substantially differ across the announcement timing conditions.
C) Only around half the municipalities that responded to inquiries mentioning plans for an announcement before the next election offered incentives.
D) Of the municipalities that received an inquiry mentioning plans for an announcement date after the next election, more than 1,200 didn't respond and only around 100 offered incentives.
Reveal answer and analysis
Answer: B
The hypothesis predicts more responses and incentives before the election than after it. Instead, each pair of bars is nearly the same height. The predicted difference did not appear, which weakens the hypothesis.
A — It describes only the before-election condition, so it cannot test a claim about the difference between conditions.
C — It again describes only one condition rather than comparing before with after.
D — The after-election numbers matter only when compared with the nearly identical before-election numbers.
Move 3: Explain How the Evidence Supports the Conclusion
How do the findings connect to the explanation? What do they support, and what would require an additional assumption?
The fynbos shrubland is a diverse habitat found only in South Africa. It is adjacent to the Afro-temperate forest, with almost no transition space between the two distinct habitats. Plants in the fynbos have uniquely thin and long root systems that spread out over large distances to absorb nutrients from the soil. Ecologists transplanted tree seedlings from the forest into plots in the fynbos. Seedlings in plots isolated from the roots of fynbos plants exhibited a growth rate five times greater than that of the seedlings in plots in close proximity to the roots of fynbos plants.
Based on the text, what role do fynbos roots most likely play in maintaining the border between the fynbos shrubland and the Afro-temperate forest habitats?
Which forest seedlings grew faster: those isolated from fynbos roots or those growing close to them?
What do the fynbos roots absorb from the soil?
How might that affect the nutrients available to forest seedlings growing nearby?
Show answer choices
A) Fynbos roots damage the root systems of forest plants, leaving those plants unable to acquire sufficient nutrients.
B) Fynbos roots extend close enough to the forest plants' roots that they constitute a physical barrier that forest plants' roots cannot pass.
C) The root systems of fynbos plants allow the plants to take in so many soil nutrients that forest plants are prevented from flourishing in the fynbos.
D) The root systems of fynbos plants enhance the soil immediately surrounding the plants, allowing them to thrive in an otherwise harsh habitat.
Reveal answer and analysis
Answer: C
Reduce the experiment to its comparison:
Near the roots → slower growth
Isolated from the roots → five times faster growth
The passage gives the missing connection: fynbos roots spread widely to absorb nutrients. Forest seedlings near those roots therefore have fewer nutrients available, which explains their slower growth and supports C.
A — The study does not show that the fynbos roots physically damage the seedlings' roots.
B — Nothing establishes that the roots form a physical barrier.
D — This describes a benefit to fynbos plants but does not explain the difference between the two groups.
Employing high-performance liquid chromatography—a process that uses pressurized water to separate material into its component molecules—astrochemist Yashiro Oba and colleagues analyzed two samples of the Murchison meteorite that landed in Australia as well as soil from the landing zone of the meteorite to determine the concentrations of various organic molecules. By comparing the relative concentrations of types of molecules known as nucleobases in the Murchison meteorite with those in the soil, the team concluded that there is evidence that the nucleobases in the Murchison meteorite formed in space and are not the result of contamination on Earth.
Which choice best describes data from the table that support the team's conclusion?
What samples did the researchers compare?
Where did the researchers conclude that the nucleobases in the meteorite formed?
If a nucleobase in the meteorite came from the surrounding soil, what would you expect to find in the soil?
Show table and answer choices
| Nucleobase | Meteorite sample 1 | Meteorite sample 2 | Soil sample |
|---|---|---|---|
| Isoguanine | 0.5 | 0.04 | not detected |
| Purine | 0.2 | 0.02 | not detected |
| Xanthine | 39 | 3 | 1 |
| Adenine | 15 | 1 | 40 |
| Hypoxanthine | 24 | 1 | 2 |
The team’s conclusion: There is evidence that the nucleobases in the Murchison meteorite formed in space and are not the result of contamination on Earth.
Which choice best describes data from the table that support the team's conclusion?
A) Isoguanine and purine were detected in both meteorite samples but not in the soil sample.
B) Adenine and xanthine were detected in both of the meteorite samples and in the soil sample.
C) Hypoxanthine and purine were detected in both the Murchison meteorite sample 2 and in the soil sample.
D) Isoguanine and hypoxanthine were detected in the Murchison meteorite sample 1 but not in sample 2.
Reveal answer and analysis
Answer: A
Isoguanine and purine were detected in both meteorite samples but not in the soil sample. That pattern weakens soil contamination as an explanation and supports A; it does not prove a space origin.
B — Molecules found in both the meteorite and soil do not distinguish a space origin from soil contamination.
C — Hypoxanthine appears in the soil, and purine does not; the choice misstates the comparison.
D — Both molecules were detected in meteorite sample 2, so the choice misstates the table. It also compares the two meteorite samples instead of comparing the meteorite with the soil.
Move 4: Check What the Evidence Can Establish
Before accepting a conclusion, check what the study ruled out and what its design or sample still leaves uncertain.
In separate studies, Marine Fernandez and colleagues and Xinhua He and colleagues examined whether plants transfer nutrients to one another using a common mycorrhizal network (CMN)—a lattice of fungal strands in the soil. Fernandez and colleagues excluded all pathways other than the CMN by using barriers to keep the plants' root systems separate while allowing mycorrhizal strands through—a crucial step He and colleagues' study did not take.
Fernandez and colleagues took the necessary precaution of separating the plants' root systems (thereby excluding root-to-root transmission). However, any barrier used must allow the thread-like hyphae of a CMN to pass through, and this permeability would also allow liquids through. Thus, the researchers' experimental design cannot ensure that any nutrient transfer observed can be attributed to a CMN and not to some other pathway.
Based on the texts, which choice best describes a similarity in the points of view presented in Text 1 and Text 2?
According to Text 1, what step did He and colleagues fail to take in their study?
According to Text 2, what can pass through Fernandez and colleagues’ barrier besides fungal strands?
Why does allowing liquids through make it difficult to determine whether nutrients were transferred through the CMN?
Show answer choices
A) Each text attempts to dispel a common misunderstanding about the likelihood of plant-to-plant nutrient transfer.
B) Each text assumes that most nutrient transfer between plants is via a CMN.
C) Each text analyzes methods for studying CMN nutrient transfer in order to propose an alternative method of study.
D) Each text critiques the methodology of a study about nutrient transfer via a CMN.
Reveal answer and analysis
Answer: D
Text 1 says that He's study failed to rule out root-to-root transfer because the plants' roots were not separated. Text 2 says that Fernandez's barrier failed to rule out transfer through liquids. Both texts therefore criticize a method that leaves another possible pathway open.
A — Neither text focuses on a widespread misunderstanding about whether nutrient transfer occurs.
B — Both texts question whether the transfer can confidently be attributed to a CMN.
C — Neither text proposes a replacement method.
For an example involving sample size, see Primate Handedness in Logical Completion. It shows why a small sample can limit what a study establishes about a broader population.
What to Remember
When a passage feels technical, do not try to master the entire subject. Put the reasoning into plain language:
- What is the pattern or comparison?
- What would the explanation predict?
- How does the evidence lead to the conclusion?
- What can the evidence actually establish?
You do not need to know all the technical vocabulary to follow the reasoning.
Franklin Yard SAT Reading & Writing Guide